visualization_deg_heatmap
Source:vignettes/visualization_deg_heatmap.Rmd
visualization_deg_heatmap.Rmd
library(RNAseqStat)
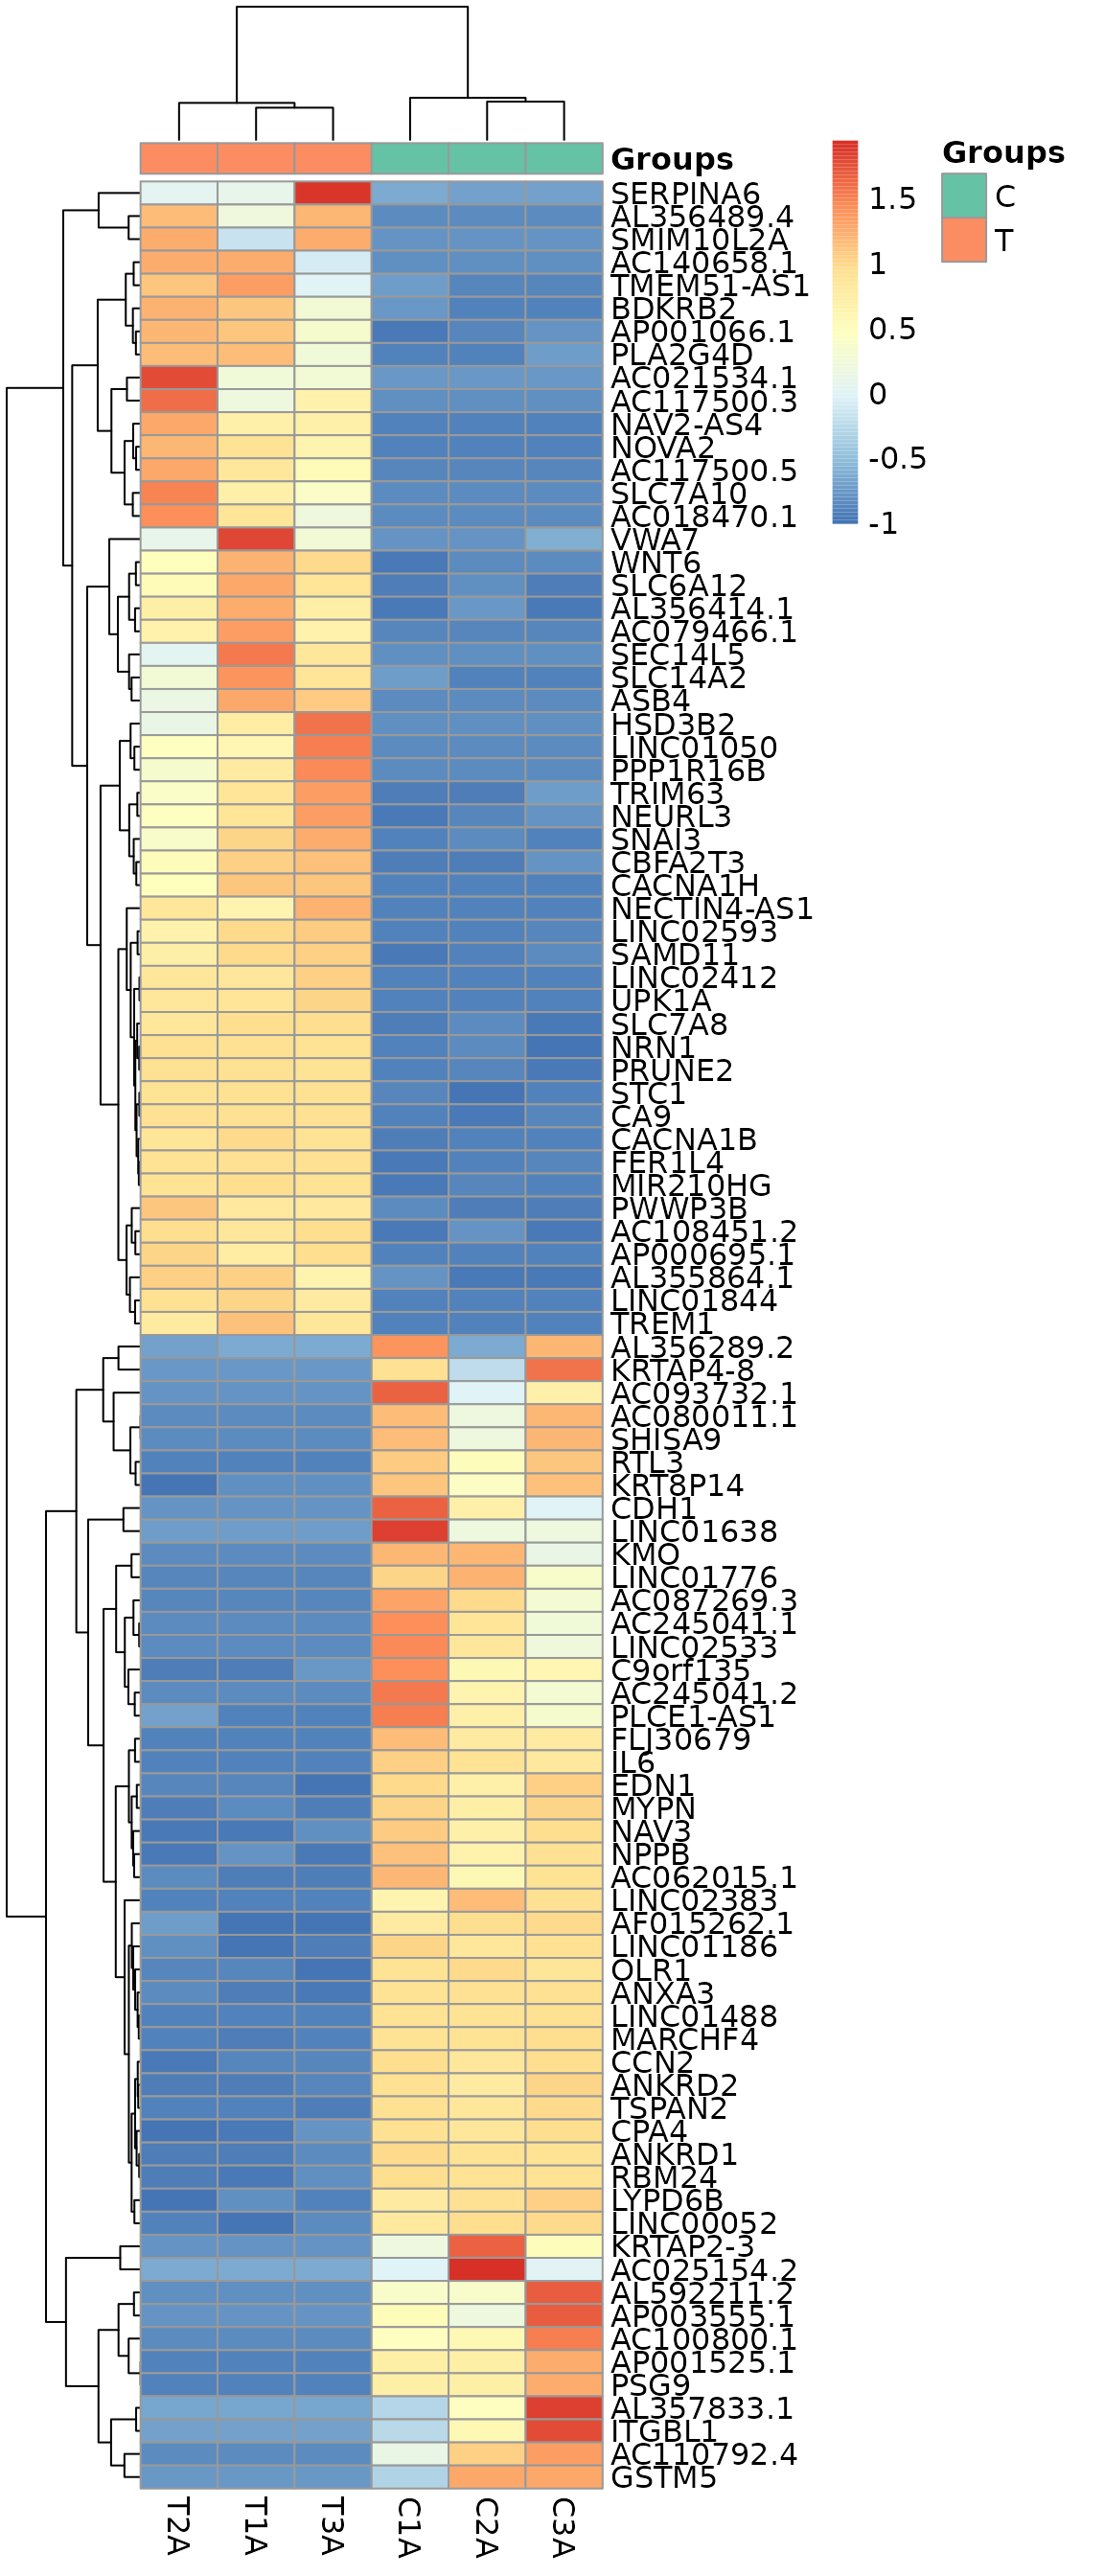
#> RNAseqStat::enhance_heatmap need counts data, group info, and DEG data frame. A heatmap of top deg genes. Plot will store in a pdf file or show in plot window when dir = NA.
enhance_heatmap(counts_input, DEG_df, group_list,
    x = "log2FoldChange", y = "pvalue", dir = NA)