visualization_gsekegg_barplot
Source:vignettes/visualization_gsekegg_barplot.Rmd
visualization_gsekegg_barplot.Rmd
library(RNAseqStat)
#>
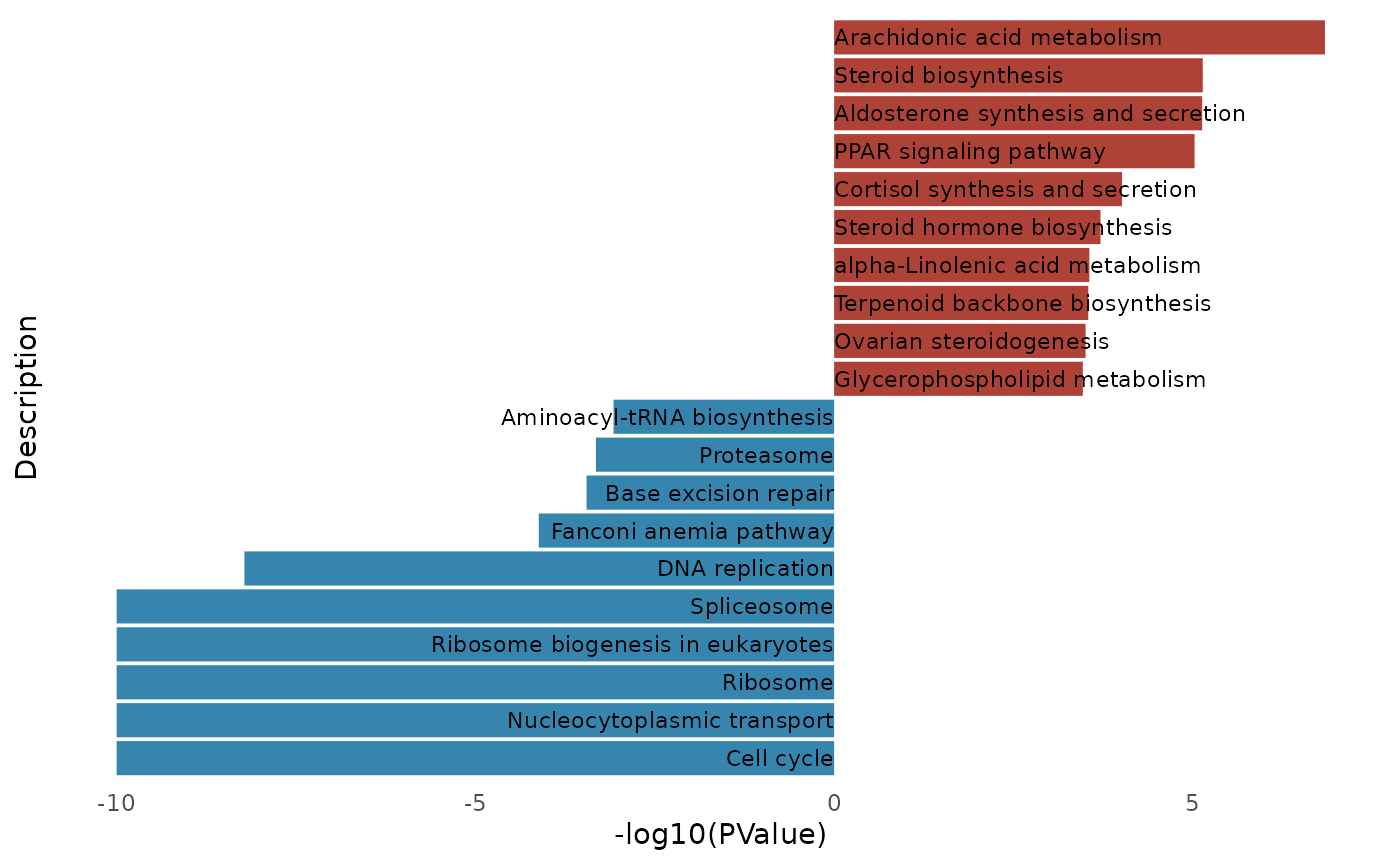
An DOSE::gseaResult-class will produced by clusterProfiler::gseKEGG or RNAseqStat::enrich_gsekegg. RNAseqStat::geskegg_barplot make a barplot from gseaResult.
test <- enrich_gsekegg(DEG_df,x = "log2FoldChange")
#>
#> 'select()' returned 1:many mapping between keys and columns
#> Warning in bitr(rownames(deg_data), fromType = "SYMBOL", toType = "ENTREZID", :
#> 22.49% of input gene IDs are fail to map...
#> Reading KEGG annotation online:
#> Reading KEGG annotation online:
#> preparing geneSet collections...
#> GSEA analysis...
#> Warning in preparePathwaysAndStats(pathways, stats, minSize, maxSize, gseaParam, : There are ties in the preranked stats (0.25% of the list).
#> The order of those tied genes will be arbitrary, which may produce unexpected results.
#> Warning in fgseaMultilevel(...): For some pathways, in reality P-values are less
#> than 1e-10. You can set the `eps` argument to zero for better estimation.
#> leading edge analysis...
#> done...
geskegg_barplot(test)