visualization_go_barplot
Source:vignettes/visualization_go_barplot.Rmd
visualization_go_barplot.Rmd
library(RNAseqStat)
#>
An DOSE::enrichResult-class will contains a data frame in result slot. RNAseqStat::enhance_barplot can make a plot from this data frame or enrichResult.
#test <- enrich_go(deg_data = DEG_df, x = "log2FoldChange", y = "pvalue")
# p <- enhance_barplot(test$Up,showCategory=10,split = "ONTOLOGY")
p <- enhance_barplot(go_res,showCategory=10,split = "ONTOLOGY")
grid::grid.newpage()
grid::grid.draw(p)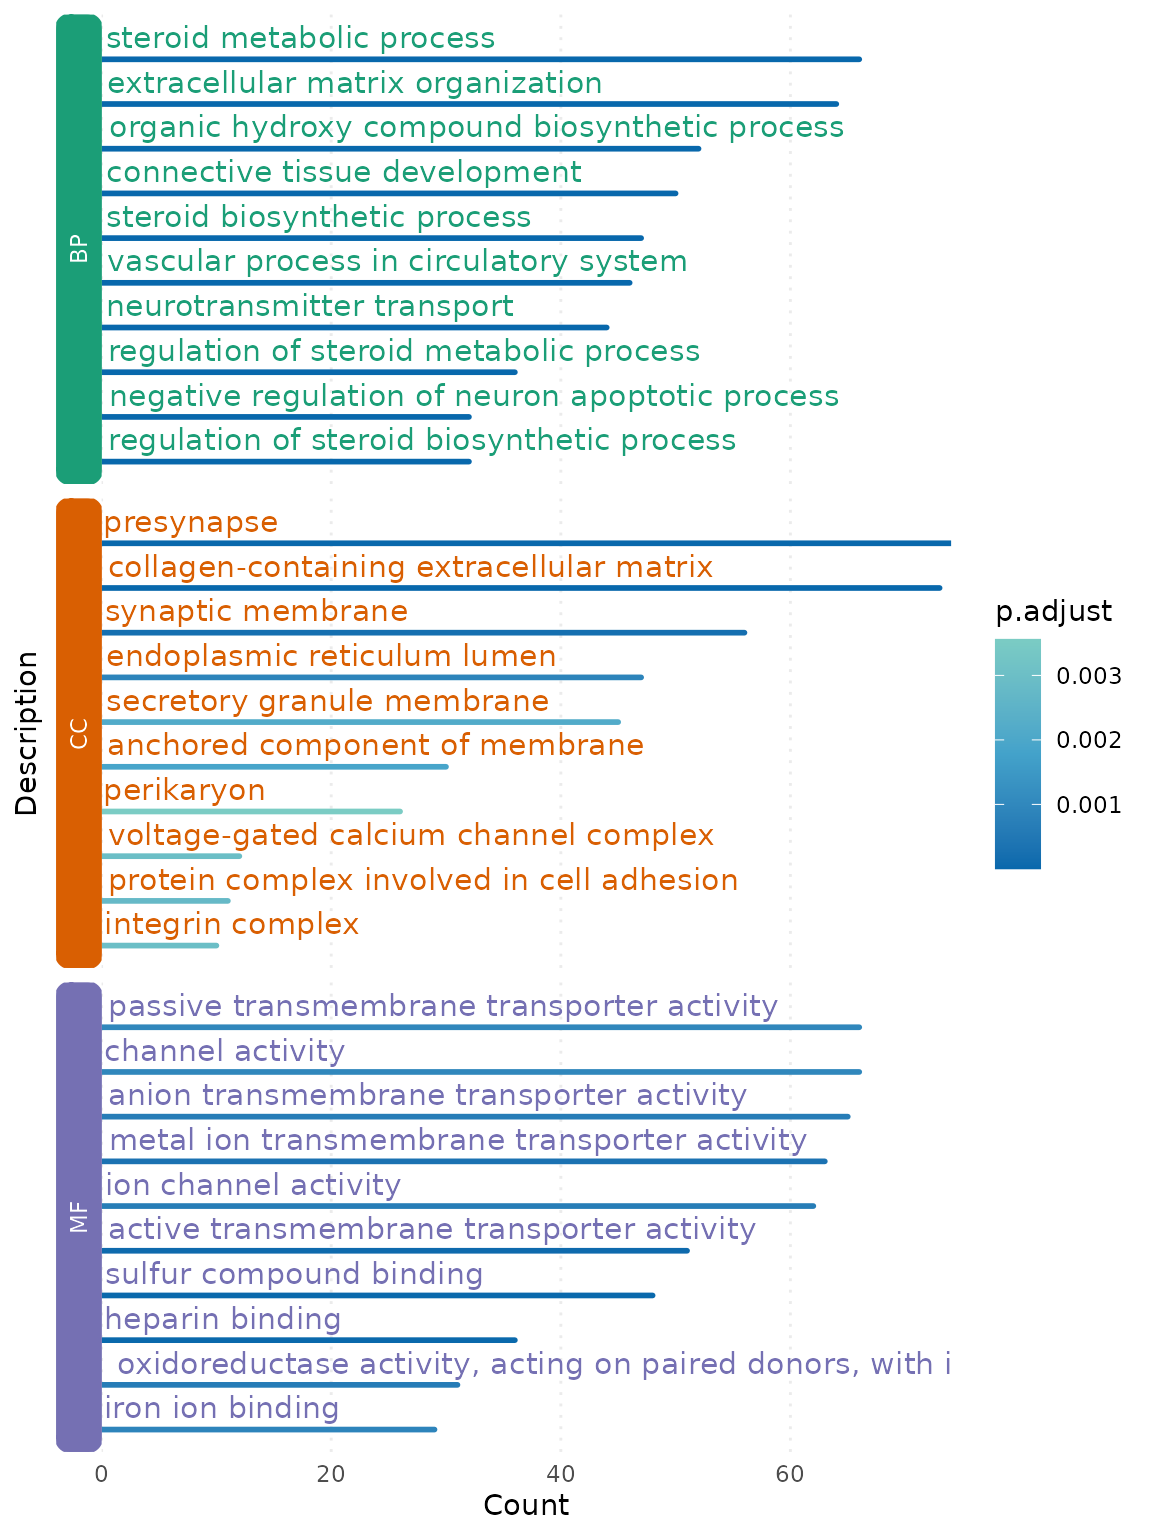
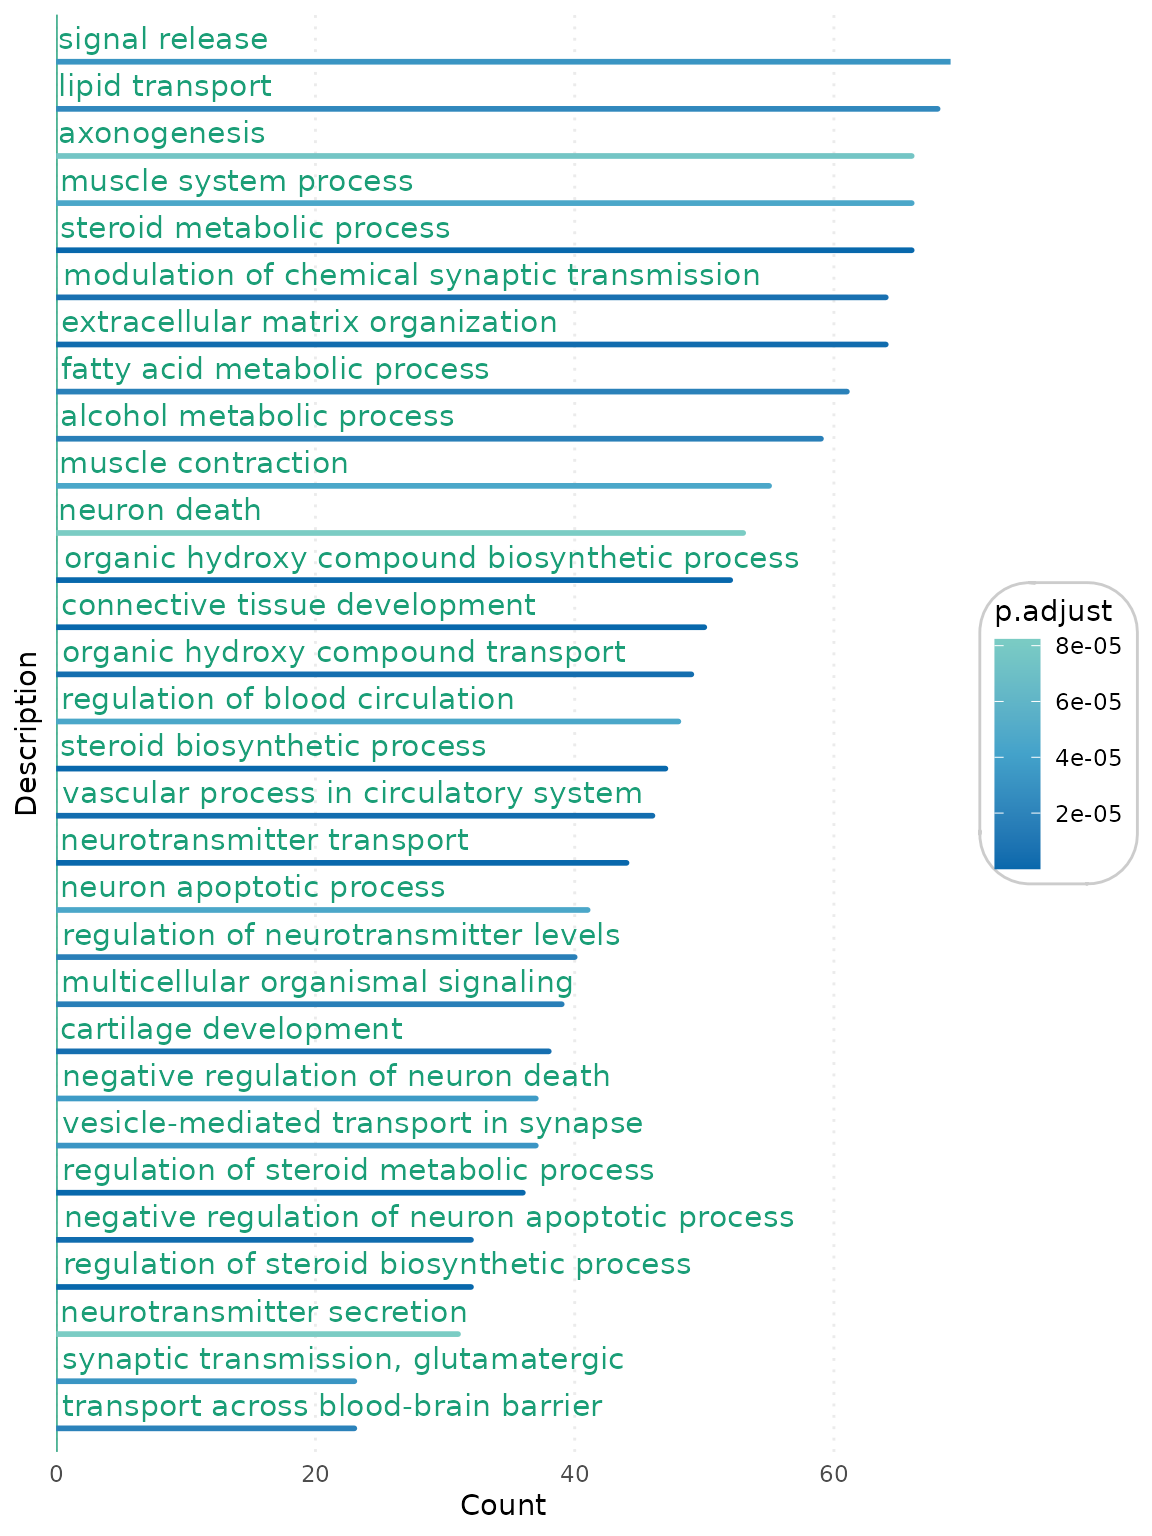
enhance_barplot(go_res,showCategory=30)