visualization_kegg_barplot
Source:vignettes/visualization_kegg_barplot.Rmd
visualization_kegg_barplot.Rmd
library(RNAseqStat)
#>
An DOSE::enrichResult-class will produced by clusterProfiler::enrichKEGG or RNAseqStat::enrich_kegg. RNAseqStat::kegg_barplot make a barplot from enrichResult.
test <- enrich_kegg(deg_data = DEG_df, x = "log2FoldChange", y = "pvalue")
#> Down 1384
#> Stable 21167
#> Up 2401
#>
#> 'select()' returned 1:1 mapping between keys and columns
#> Warning in clusterProfiler::bitr(SYMBOLS_id, fromType = "SYMBOL", toType =
#> "ENTREZID", : 17.56% of input gene IDs are fail to map...
#> 'select()' returned 1:many mapping between keys and columns
#> Warning in clusterProfiler::bitr(SYMBOLS_id, fromType = "SYMBOL", toType =
#> "ENTREZID", : 19.62% of input gene IDs are fail to map...
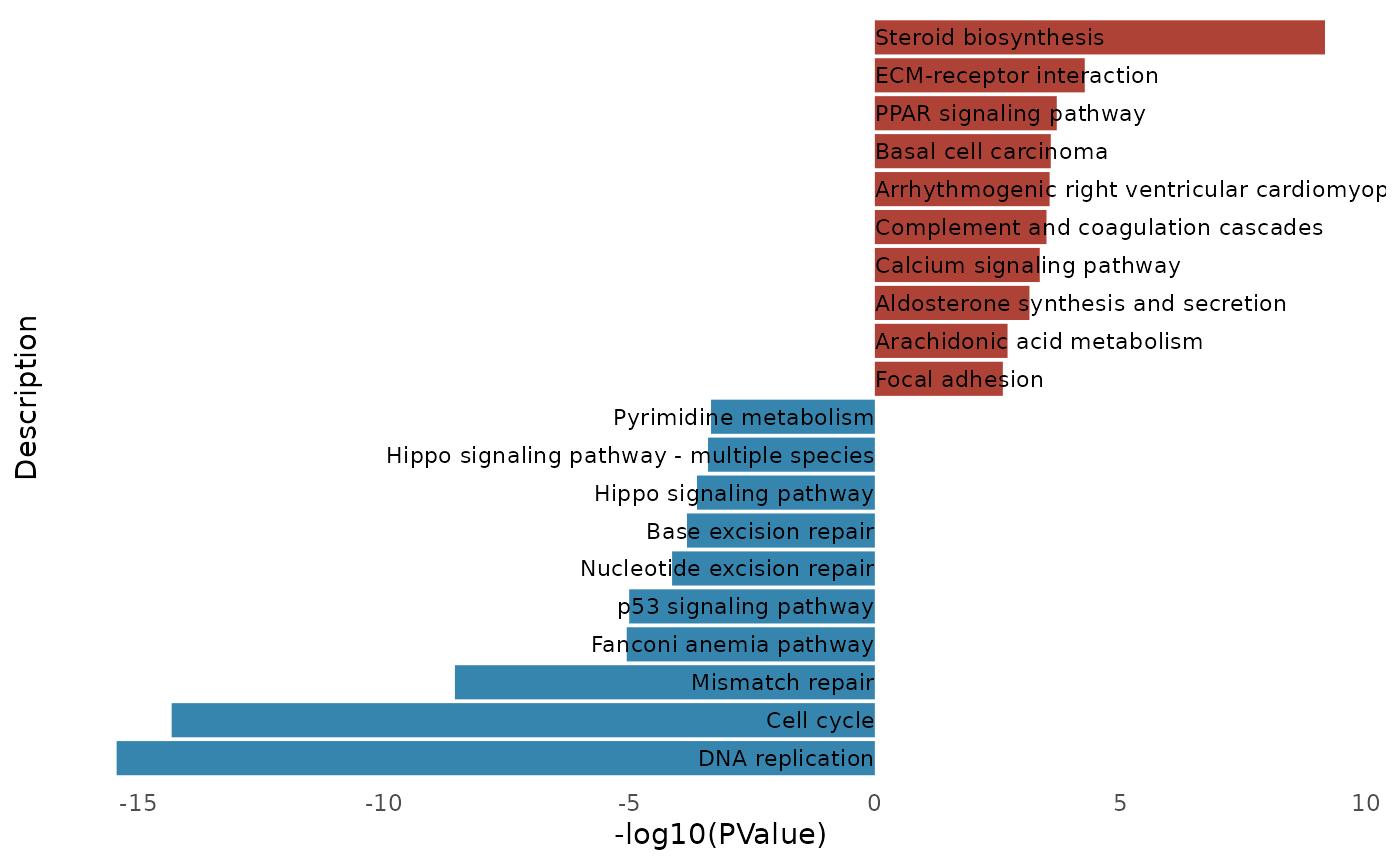
#> 🌳 Enrich KEGG analysis Start. This process will take a few minutes.
kegg_barplot(test)