Stack mutations to node and make branch length to number of mutation
Source:R/stackMutaionsBranch.R
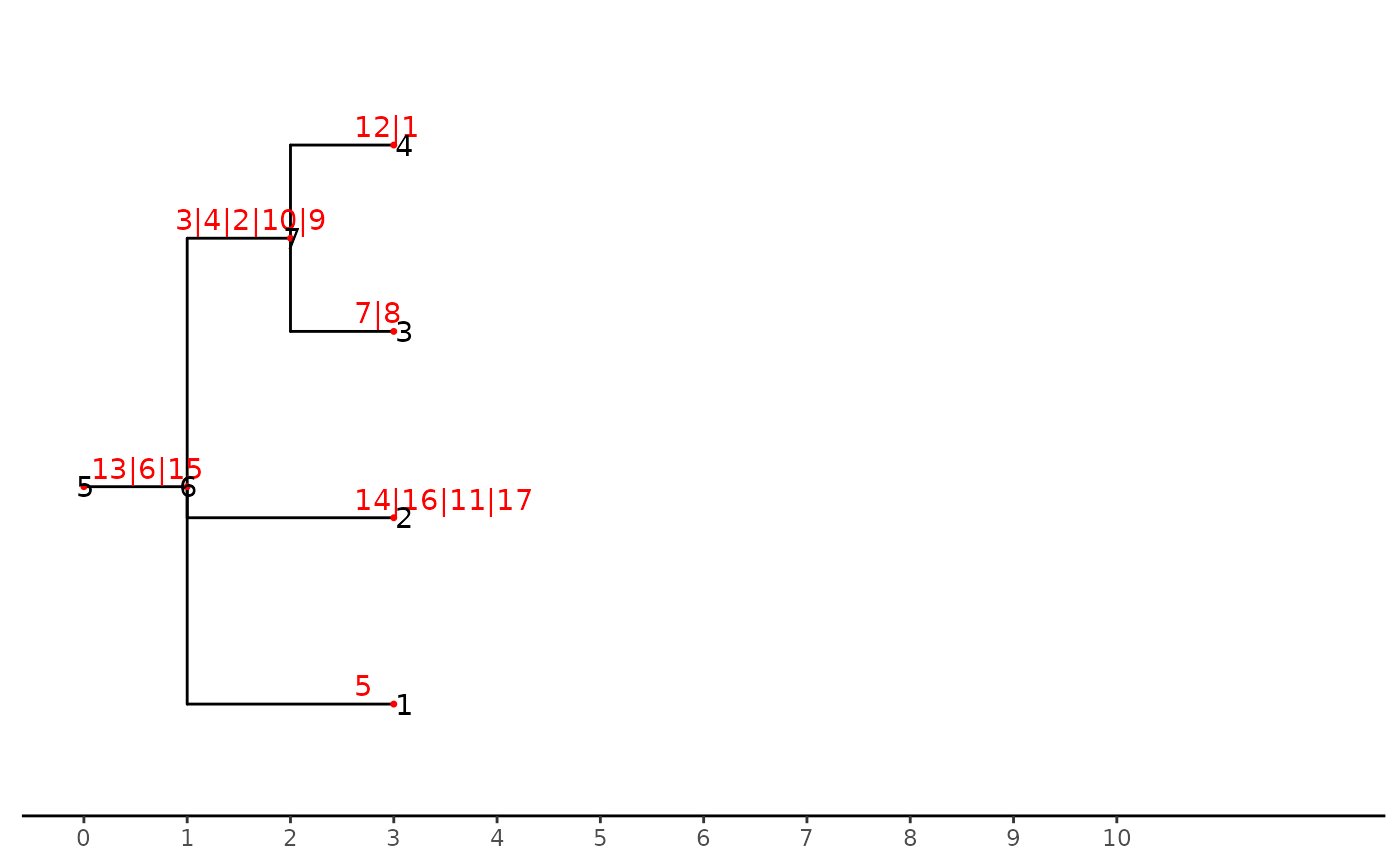
stack_mutationTree.Rdstack_mutationTree is a naive function for stack mutation node in branch to node in a mutation tree of class "phylo".
stack_mutationTree(tre)Value
a tree of class "phylo"
Examples
library(ggtree)
#> ggtree v3.16.2 Learn more at https://yulab-smu.top/contribution-tree-data/
#>
#> Please cite:
#>
#> Guangchuang Yu, David Smith, Huachen Zhu, Yi Guan, Tommy Tsan-Yuk Lam.
#> ggtree: an R package for visualization and annotation of phylogenetic
#> trees with their covariates and other associated data. Methods in
#> Ecology and Evolution. 2017, 8(1):28-36. doi:10.1111/2041-210X.12628
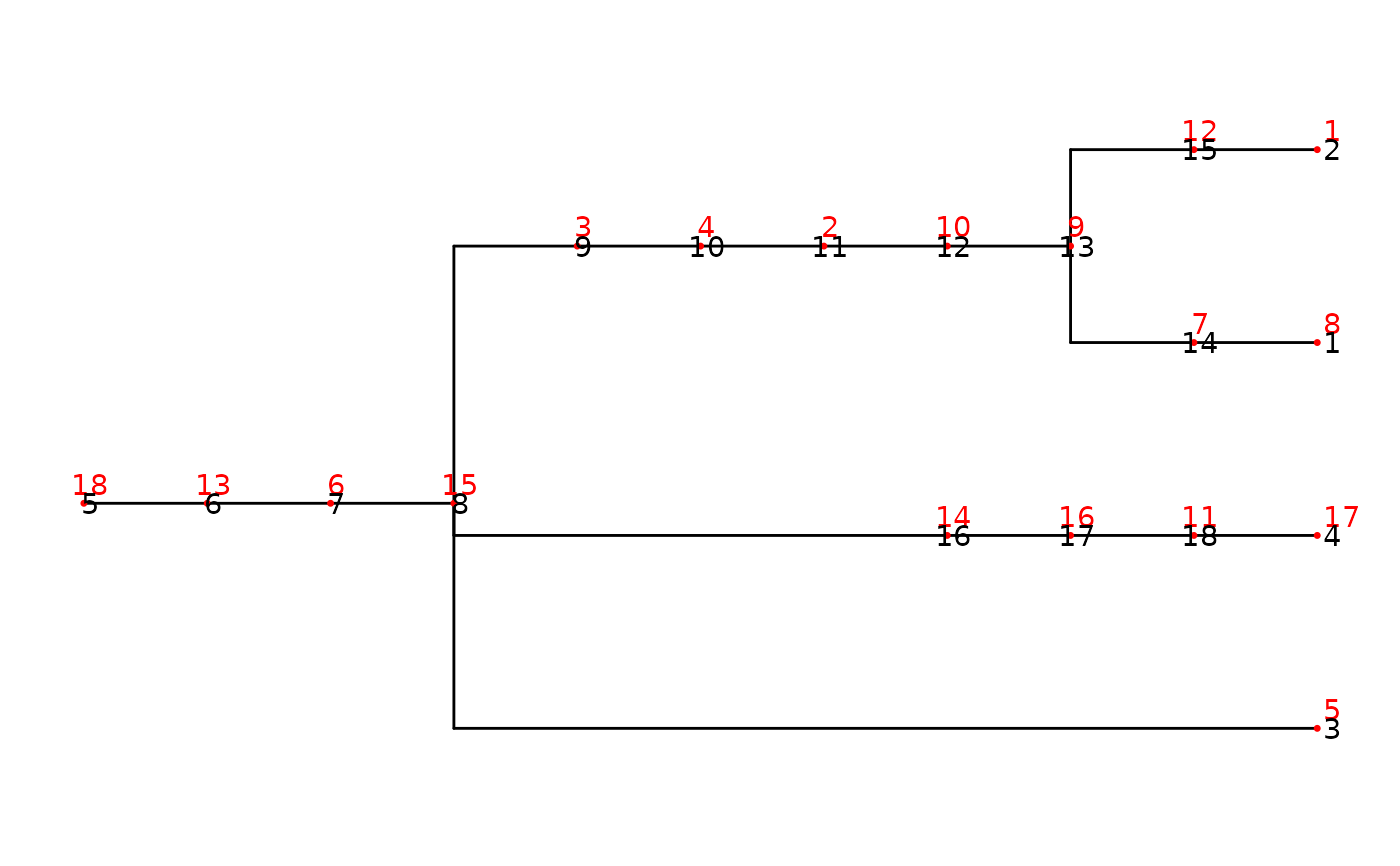
nwk_text = "((((((((((8)7,(1)12)9)10)2)4)3,5,(((17)11)16)14)15)6)13)18;"
tre <- treeio::read.newick(text = nwk_text)
ggtree(tre) +
    geom_nodepoint(size = 1,color = "red",shape = 20) +
    geom_nodelab(color = "red",nudge_y = 0.1)+
    geom_nodelab(aes(label = node))+
    geom_tippoint(size = 1,color = "red",shape = 20)+
    geom_tiplab(color = "red",nudge_y = 0.1)+
    geom_tiplab(aes(label = node))

stre <- stack_mutationTree(tre)
ggtree(stre)+
  geom_nodepoint(size = 1,color = "red",shape = 20) +
  geom_nodelab(color = "red",nudge_y = 0.1,nudge_x = -0.4)+
  geom_nodelab(aes(label = node))+
  geom_tippoint(size = 1,color = "red",shape = 20)+
  geom_tiplab(color = "red",nudge_y = 0.1,nudge_x = -0.4)+
  geom_tiplab(aes(label = node))+
  theme_tree2()+
  scale_x_continuous(breaks = c(0:10), limits = c(0,12))
